Has IGG Mulyagonja failed at her job? Here are the statistics
The IGG Irene Mulyagonja is in the eye of the storm following President Museveni’s revelation on Wednesday that he is going to set up an ant-corruption unit at State House.
The president said many people had lost confidence in the office of the Inspectorate of Government because its officers are compromised.
Keep Reading
Mulyagonja has shot back saying that she believes she has done a good job despite the challenges. She also cast doubt on whether the State House unit would be effective.
Yet the key question is: How has the office of the Inspectorate of Government performed under Mulyagonja’s tenure?
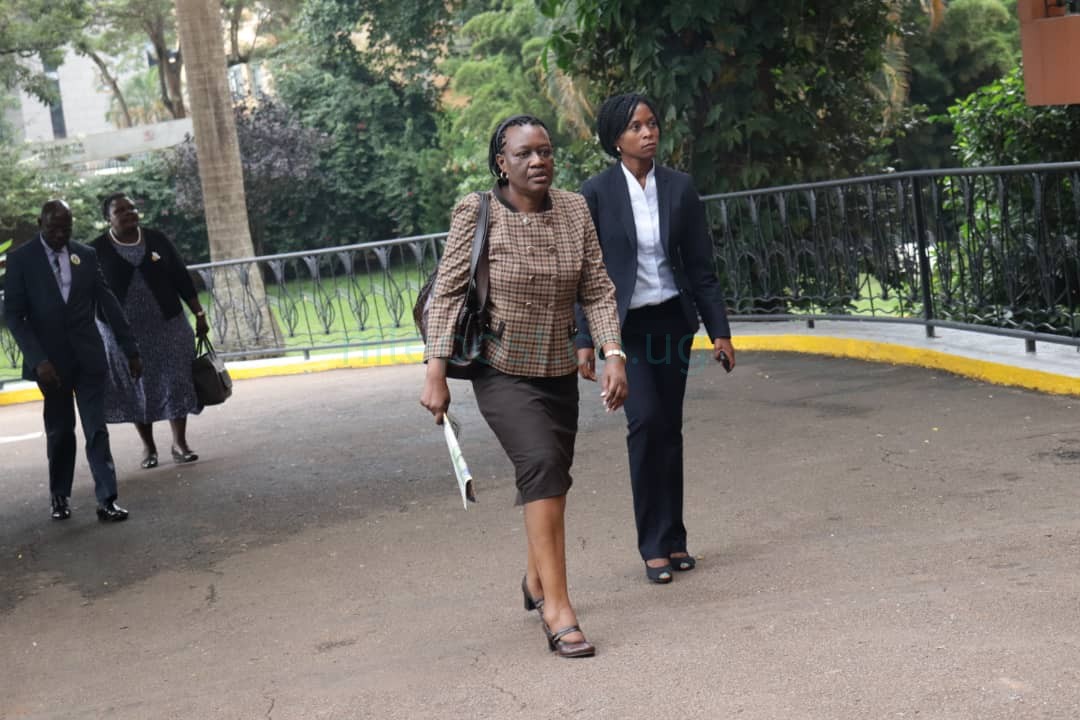 Mulyagonja arriving for the state of the nation address
The Nile Post compiled data on cases handled by the IG (see tables below) and below gives you an assessment of its performance.
In the financial year 2016/17, a total of 2,876 corruption complaints were registered by the IG.
Of these 1,316 were recorded at the head office and 1,560 recorded at the regional offices.
In general, 2, 486 of these cases were concluded although the IG was able to prosecute only 40 cases resulting in 24 convictions.
Mulyagonja’s office was also able to recover Shs 718 million in the 2016/2017 financial year.
In the current financial year 2017/18, the IG registered a total of 734 complaints by the end of September of which 338(46%) were registered at the head office while 396(54%) were registered across the regional offices.
Of these, 509 (30%)investigations were concluded while 130 cases were referred to other institutions.
As of June this year, 4409 investigations are still ongoing while Shs 107 million has been recovered so far.
In addition, 90 % of all political leaders have declared their income, assets and liabilities to the IG as required by the Leadership Code Act.
However, in all her reports the IGG has continuously pointed out the challenges of implementing her mandate.
They include underfunding and inadequate human resource, failure by government agencies to implement her recommendations and big government shots who threaten the life of IG officers.
Table showing corruption complaints investigated and completed during the period January – June 2015
Nature of complaint Number of complaints Percentage
| Abuse of office | 157 | 16.5% |
| Corruption | 108 | 11.4% |
| Misappropriation | 70 | 7.4% |
| Investigations arising from Audit Reports | 66 | 6.9% |
| Bribery | 53 | 5.6% |
| Embezzlement | 47 | 4.9% |
| Forgery | 35 | 3.7% |
| False Claims | 30 | 3.2% |
| Conflict of interest | 29 | 3.1% |
| Extortion | 27 | 2.8% |
| Nepotism and Irregular recruitment | 18 | 1.9% |
| Total
|
640 | 67.4%
|
Corruption complaints investigated and completed during the period July – December 2015
Nature of Complaint Investigated Percentage
| Abuse of office | 347 | 24.2% |
| Corruption | 161 | 11.2% |
| Investigations arising out of Audit reports | 101 | 7.0% |
| Embezzlement | 61 | 4.3% |
| Misappropriation of public funds | 61 | 4.3% |
| Forgery and uttering of false documents | 59 | 4.1% |
| Bribery | 42 | 2.9% |
| Conflict of interest | 28 | 1.9% |
| False Claims | 20 | 1.4% |
| Extortion | 20 | 1.4% |
| Nepotism/Irregular recruitment | 16 | 1.1% |
| Sub Total
|
916 | 63.8% |
Corruption complaints investigated and completed during the period January – June 2016
Nature of Complaints Investigated Percentage
| Abuse of office | 199 | 19.7%
|
|||
| Corruption | 128 | 12.7%
|
|||
| Forgery and uttering of false documents | 73 | 7.2%
|
|||
| Investigations arising out of Audit reports | 65 | 6.4%
|
|||
| Misappropriation of public funds | 53 | 5.3%
|
|||
| Embezzlement | 38 | 3.8%
|
|||
| False Claims | 36 | 3.6%
|
|||
| Bribery | 22 | 2.2%
|
|||
| Conflict of interest | 18 | 1.8%
|
|||
| Extortion | 18 | 1.8%
|
|||
| Nepotism/Irregular recruitment | 8
|
0.8% | |||
Sub Total 658 65.2%
Corruption complaints investigated and completed during the period July - December 2016
Nature of complaint Percentage
| Abuse of office | 208 | 17.3% |
| 2. Corruption | 119 | 9.9%. |
| Investigations arising out of audit Reports from OAG | 87 | 7.2% 4 |
| Forgery and uttering of false documents | 67 | 5.6% |
| Misappropriation of public funds | 64 | 5.3% |
| Embezzlement | 59 | 4.9% |
| Causing financial loss | 53 | 4.4% |
| False Claims | 47 | 3.9% |
| Bribery | 45 | 3.7% |
| Extortion | 24 | 2.0% |
| Conflict of interest | 21 | 1.7% |
| Nepotism/irregular recruitment | 18 | 1.5% |
| Sub Total | 812 | 67.6% |
Corruption complaints investigated and completed during the period January – June 2017
Nature of Complaints Number of complaints %age
| Abuse of office | 223 | 19.8% |
| Corruption | 151 | 13.4% |
| Investigations arising out of Audit Reports from OAG | 88 | 7.8% |
| Embezzlement | 65 | 5.8% |
| Forgery & uttering false documents | 51 | 4.5% |
| Misappropriation | 50 | 4.4% |
| False Claims | 22 | 2.0% |
| Conflict of interest | 21 | 1.9% |
| Bribery | 18 | 1.6% |
| Nepotism | 13 | 1.2% |
| Extortion | 7 | 0.6% |
| Sub Total | 714 | 63.4%
|